CLS at BuzzFeed — Part 3: Dealing with the unpredictable
This article is part of a three-part series documenting how BuzzFeed tackled their issues with Cumulative Layout Shift as part of a broader Web Vitals initiative. Take a look at parts one and two.
At BuzzFeed, we publish a large number of articles every day, with many of them containing multiple third-party embeds. These are unpredictable by nature and were one of the bigger remaining pieces we were yet to find a solution for regarding CLS. This article focuses on how we reduced layout shifts caused by embedded content, leading to over 75% of our pages views having a good Cumulative Layout Shift (CLS) score! 🎉

(1) Default embed code (2) Styles and scripts (3) Media elements when available
There are many excellent resources on how to minimize the CLS impact caused by third-party embeds. A common approach is to inspect a rendered embed to get its dimensions, and then style the placeholder to match. There are tools that can do this for you and will even generate the CSS. The challenge is to scale this approach on a big website.
This article documents how we leveraged our existing analytics pipeline for near real-time observability and created a crowdsourced solution for eliminating layout shifts from embedded content.
Case Study: TikTok
TikTok embeds do not define their height in the embed code, nor do they use any kind of placeholder element for the main video. In addition, when testing on a slow device, we observed the following series of layout shifts during load:
- 👊 The TikTok embed script asynchronously loads the placeholder styles.
- 🤕 The height changes one last time to its final size when the embed completes loading.
The Predictable
Most of the issues listed above can be helped by inlining placeholder styles with values we can reasonably predict. We defined a set of guidelines to help us come up with values that are as accurate as possible.
- Our placeholders should include common UI elements (an empty header and footer, for example).
- Inspect the embed at different viewport sizes to get a base set of styles. Include font sizes, paddings, margins, borders, and common UI elements. Apply inline styles on the placeholder to match.
- Add a placeholder for a media element (e.g., images and videos) if one is missing. Use the most commonly known aspect ratio for the media element or fallback to 16:9.
Following these steps for the TikTok embed, we defined a min-height of 740px on the parent element. The value is the sum of the video placeholder height (575px) and the description area (165px). The description height is based on the intrinsic size of the element with two lines of the wrapped text. Fortunately for us, this worked across all viewports, producing placeholders that are close in size to the actual embed, sometimes just a few pixels off.

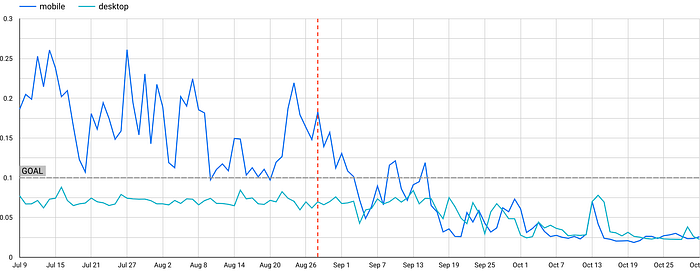
This dramatically improved the CLS score! The chart below shows daily CLS scores based on the 75th percentile of page views, segmented by articles that contain at least one TikTok embed. There is a steep decline after releasing this update (denoted by the red vertical line):

The Unpredictable
While these results showed a huge improvement, we had not yet qualified 75% of page views as “good” (CLS score of 0.1 or less). We also knew that this was an imperfect solution, with its own set of challenges and unknowns:
- Some providers do not include a width and height to account for media elements. Some do not include a hint if a media element even exists.
- The dimensions would need to be recalculated periodically to stay up-to-date as third parties can update their embed styles without warning, altering the rendered dimensions.
- The BuzzFeed CMS allows for all types of embed code. The CMS would need ongoing support for optimizing new placeholders.
Crowdsourcing Accurate Data
To solve these challenges and get insight into the unknowns listed above, we used a crowdsourced approach: gathering the embed’s dimensions from our users and collecting them via our analytics pipeline. We built a Content Layout Stability API (sharing the same acronym as the web vital metric it aims to improve) to make that data available to the rendering layer. Embeds can now be correctly sized before the third-party code is loaded or executed. This works across all breakpoints.

The data is anonymously sent when users meet the following criteria:
- A modern browser (native support for ResizeObserver and other required APIs).
- A fast network connection, 4G or faster (navigator.connection.effectiveType).
- The user has not set a reduced data usage option (navigator.connection.saveData).
I’ve created a gist of our JavaScript package if you are interested in adapting to your needs. We welcome any suggestions for improvement.
The Impact 🎉
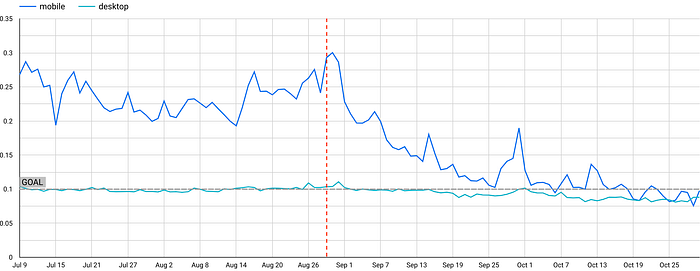
Expanding on the TikTok case study, the following graph shows the impact of releasing the CLS API has had on pages containing TikTok embeds:
After applying dimensions from the API to all other social embeds, we continued to see a gradual improvement across the entire buzzfeed.com origin:
At the time of writing, ~80% of all our page views have a good CLS score on both desktop and mobile! A massive improvement from where we started at ~20%.

It was an enormous effort to improve our Cumulative Layout Shift score across so many pages with so much variable content. Our Content Layout Stability API not only helped us achieve the goal, but it pushed us way over. It sets us up for success as content creators can add new embed types without fear of introducing layout shifts. Our new set of tools can help us quickly make any part of our site reach and sustain a “good” CLS score with little or no additional effort going forward.
This article was co-authored with Ian Feather. Many thanks to Maria Enderton for her contributions.
BuzzFeed Tech is hiring! 👋
If you are interested in browsing openings, check out buzzfeed.com/jobs. We have roles based in Los Angeles, Minneapolis, London, and New York with options for remote work!